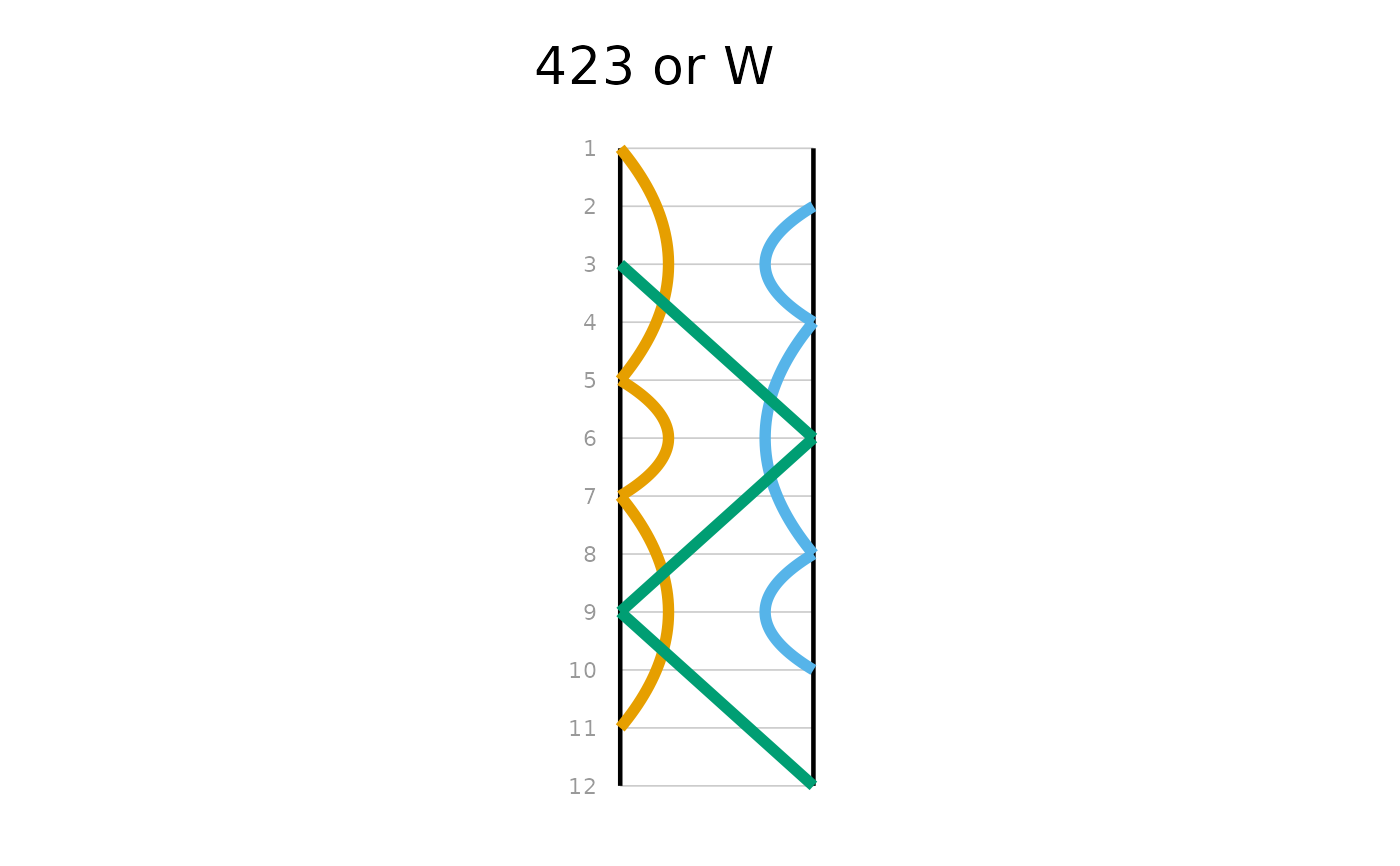
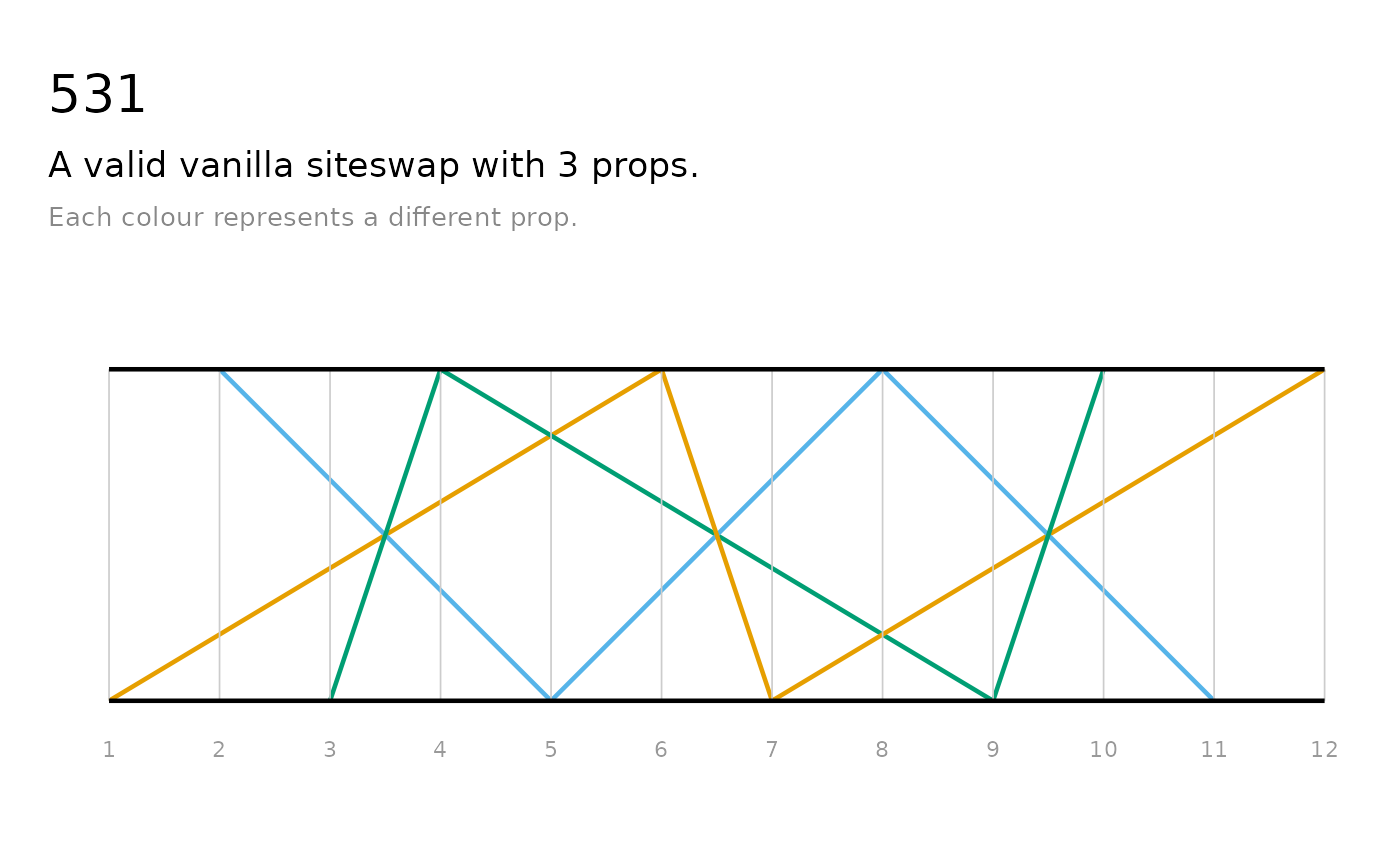
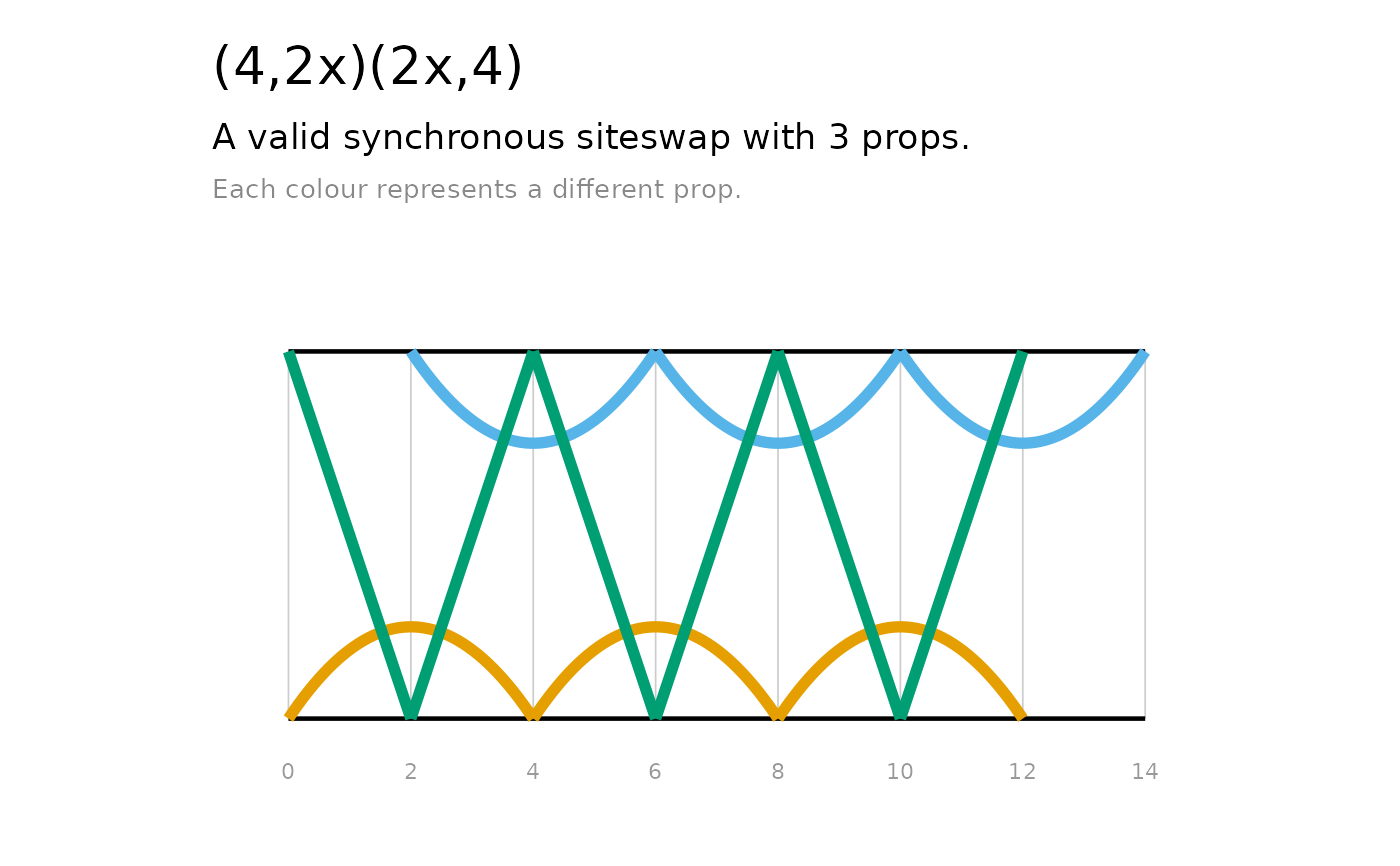
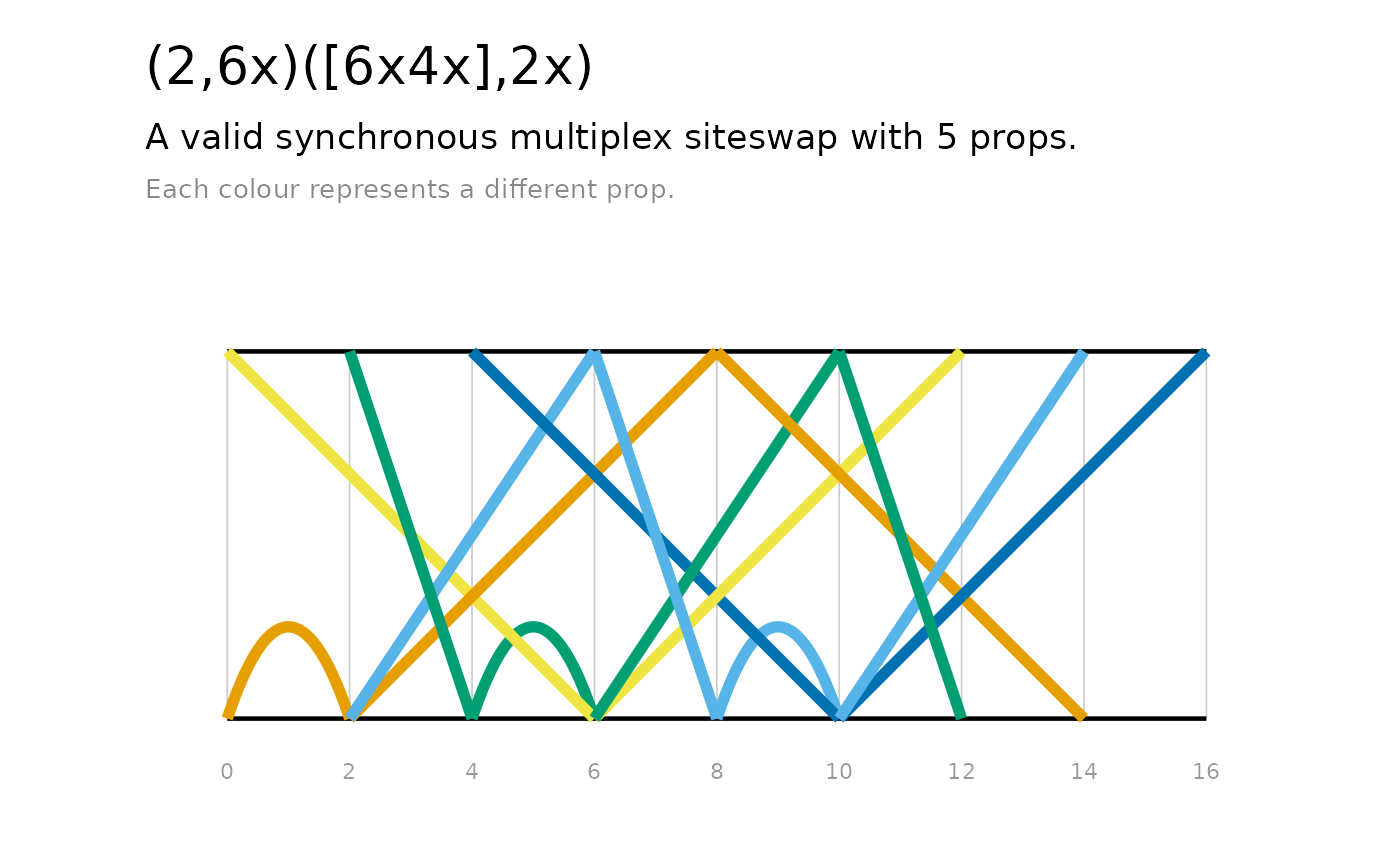
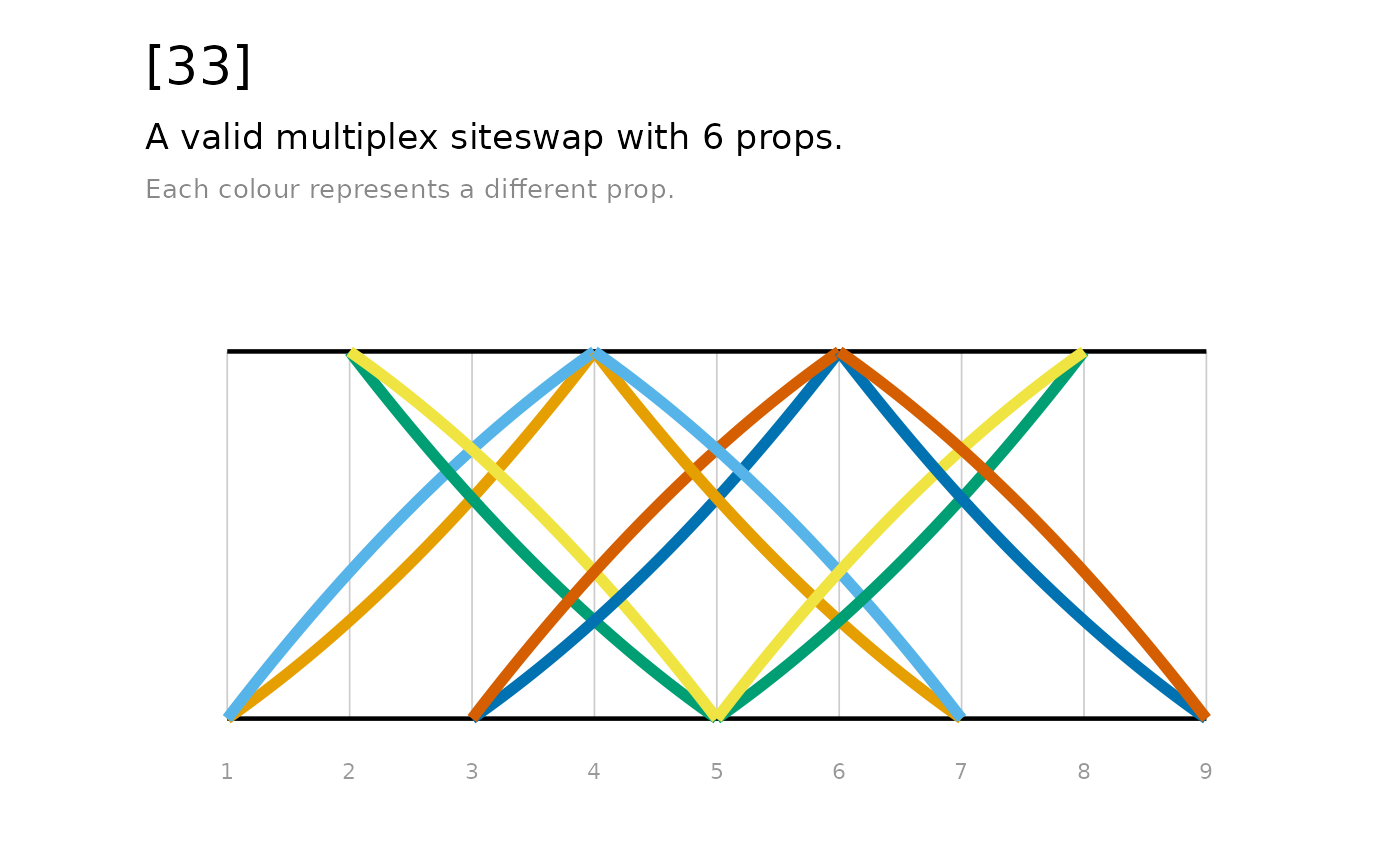
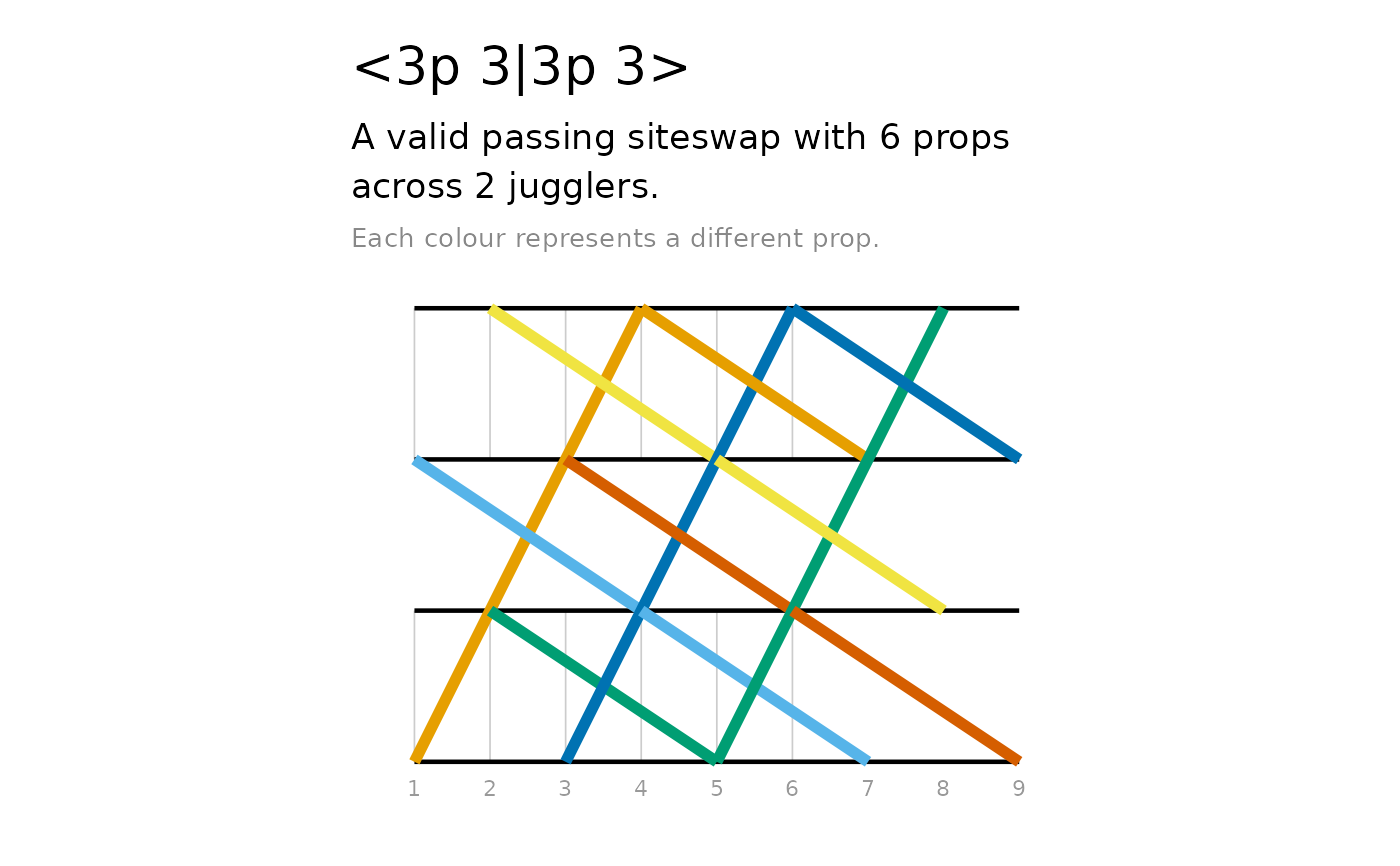
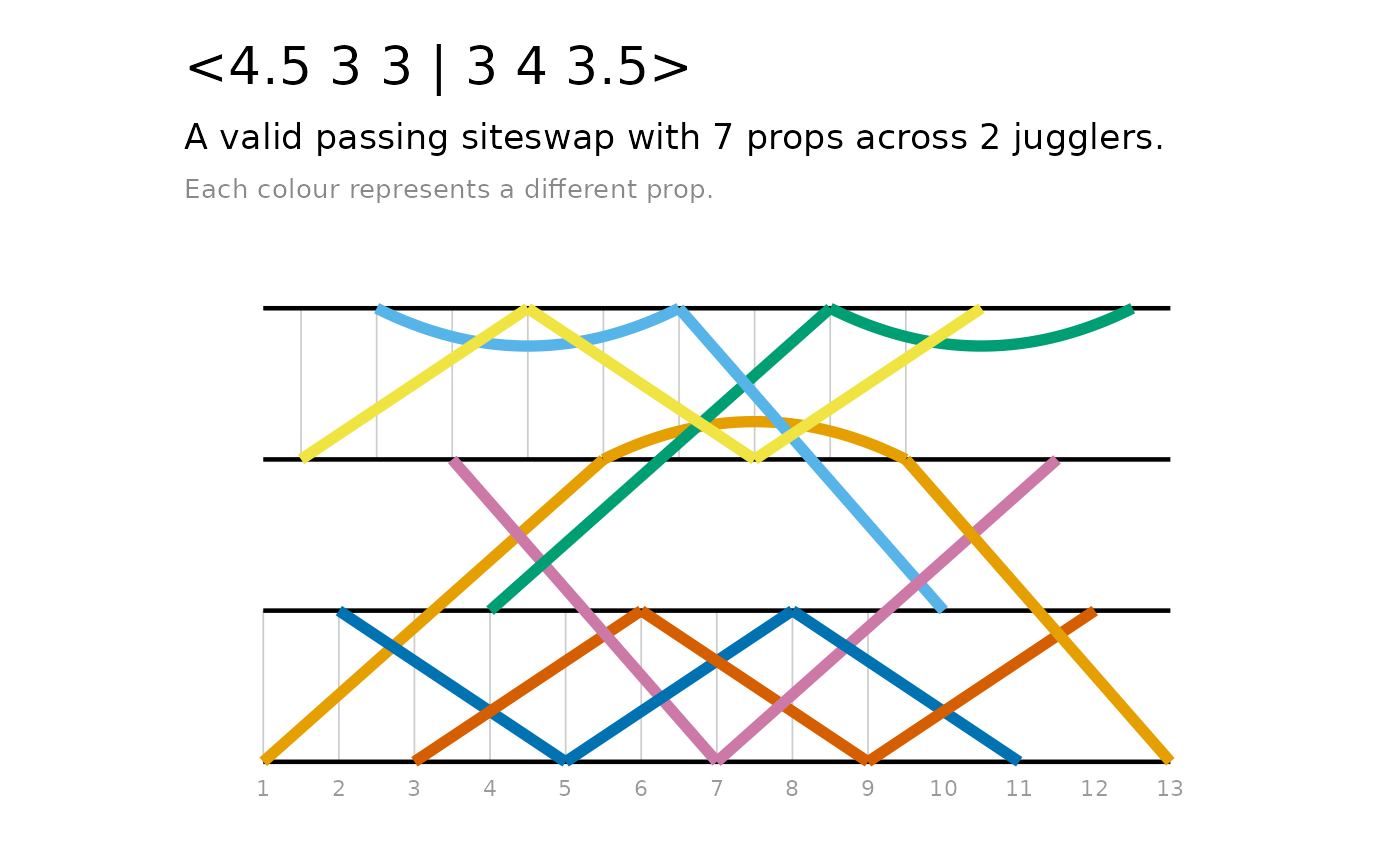
Produces a ladder diagram showing prop paths between hands across beats. The rails represent the hands and the rungs represent the beats. Each throw connects to its catch: cross-hand throws are drawn as straight segments between the rails, while same-hand throws curve back to the same rail. Throws are coloured by prop using the colour-blind-friendly Okabe-Ito palette (a ggplot2 default scale is used beyond seven props), and beat numbers are labelled along the axis.
Usage
ladder(
  siteswap,
  n_cycles = 3,
  direction = c("horizontal", "vertical", "h", "v"),
  title = TRUE,
  subtitle = TRUE,
  ...
)
Arguments
- siteswap
A vanillaSiteswap, synchronousSiteswap, multiplexSiteswap, synchronousMultiplexSiteswap, or passingSiteswap object.
- n_cycles
Number of complete cycles to simulate (default 3).
- direction
Orientation of the diagram:
"horizontal"(default, time runs left to right) or"vertical"(time runs top to bottom). Shorthands"h"and"v"are also accepted.- title
Logical. If
TRUE(default), adds a title showing the siteswap sequence. Set toFALSEto suppress; override withggplot2::labs()on the returned plot.- subtitle
Logical. If
TRUE(default), adds a subtitle showing the siteswap type and number of props. Set toFALSEto suppress; override withggplot2::labs()on the returned plot.- ...
Additional arguments passed to methods. For
passingSiteswapobjects,hand_gap(default2) sets the vertical spacing between each juggler's two hands in the diagram.
Details
ladder() is an S7 generic. There are methods available for the following
classes:
Where multiplex throws overlap (e.g. [33]), the lines fan apart slightly
so they are visible. Passing patterns use one pair of rails per juggler,
spaced by hand_gap and throws between jugglers cross between the rails.
The result is a standard ggplot2 object, so beyond the title and subtitle
toggles you can modify it by adding any ggplot2 function, for example
ggplot2::labs() or ggplot2::scale_colour_manual().
See also
The siteswap constructors, e.g. siteswap() and vanillaSiteswap().
Other siteswap visualisation:
throw_data(),
timeline()
Examples
# Vanilla: straight cross-hand throws, curved same-hand throws
ladder(siteswap("423"))
 # Synchronous: even-only beat numbering, crossing denoted by "x"
ladder(siteswap("(4,2x)(2x,4)"))
# Synchronous: even-only beat numbering, crossing denoted by "x"
ladder(siteswap("(4,2x)(2x,4)"))
 ladder(siteswap("(2,6x)([6x4x],2x)"))
 # Multiplex: identical simultaneous throws fan into separate curves
ladder(siteswap("[33]"), n_cycles = 6)
# Multiplex: identical simultaneous throws fan into separate curves
ladder(siteswap("[33]"), n_cycles = 6)
 # Passing: one pair of rails per juggler
ladder(siteswap("<3p 3|3p 3>"))
# Passing: one pair of rails per juggler
ladder(siteswap("<3p 3|3p 3>"))
 ladder(siteswap("<4.5 3 3 | 3 4 3.5>"))
 # Vertical orientation, and customise like any ggplot2 object
ladder(siteswap("423"), direction = "v", subtitle = FALSE) +
ggplot2::labs(title = "423 or W")
# Vertical orientation, and customise like any ggplot2 object
ladder(siteswap("423"), direction = "v", subtitle = FALSE) +
ggplot2::labs(title = "423 or W")